

You looked up your form on the USCIS processing times page, saw a number, and worked out roughly when you would hear back. That date has passed and your case status still has not moved. Your filing is probably fine, and so is the number you found. The trouble is what the USCIS average processing time is built from, and what it leaves out.
Every published wait time, whether it comes from the monthly report to Congress or the processing times tool on the USCIS website, is calculated from cases that have already been decided. Cases still waiting contribute nothing to it. So the longer a case sits, the less it counts, and the number ends up describing the applications that got out rather than the pile that stayed in. Our companion guide to what the USCIS net backlog measures covers a related metric, and the wider USCIS backlog explains how the queue grew this large. The wait-time number itself is what concerns us here: what it measures, and where that measurement stops describing you.
What the processing time number actually measures
There are two official numbers in circulation, and neither is an estimate of your case.
The first is the figure on the USCIS processing times tool. USCIS defines it as the amount of time it took to complete 80 percent of adjudicated cases over the last six months, measured from the receipt date to the date the case was approved or denied (USCIS, More Information About Case Processing Times). The word doing the work there is adjudicated. A case filed two years ago and still pending has never been adjudicated, so it has never entered the calculation. The 80 percent is a deliberate cutoff too, which means one in five decided cases took longer than the posted figure by design.
The second is the average in the monthly report USCIS sends to Congress. That report defines it as the number of months from receipt to completion, and states plainly that the average is calculated using all applications and petitions completed in the reporting period (USCIS Report to Congress, Number of Service-Wide Forms, May 2026). That figure has the same blind spot as the first one, because it also counts only the cases that closed.
This is not USCIS hiding anything. Both metrics are labeled accurately and both are useful for tracking whether the agency is getting faster or slower at finishing work. They are simply backward-looking measures of throughput, not forecasts. Treating either one as a prediction of when your receipt notice turns into a decision is the mistake, and it is an easy one to make when the number is presented as a wait time.
The USCIS average processing time next to the actual queue
The monthly report is unusual in that it publishes both halves of the picture side by side: the average time for cases that finished, and the number of pending cases that have already been waiting more than six months. The two columns sit further apart than the published averages alone would suggest.
These are the May 2026 figures for the major forms.
| Form | Reported average (months) | Cases pending | Share already waiting over 6 months |
|---|---|---|---|
| I-765 Work permit | 4.7 | 2,119,836 | 63% |
| I-485 Employment-based | 9.3 | 266,656 | 52% |
| I-360 Special immigrant | 9.7 | 308,016 | 80% |
| N-400 Naturalization | 10.1 | 712,572 | 62% |
| I-485 Family-based | 11.9 | 604,796 | 73% |
| I-130 Family petition | 18.4 | 2,424,101 | 87% |
| I-751 Remove conditions | 24.3 | 325,956 | 74% |
The work permit line is the clearest case. A reported average of 4.7 months sounds fast, and for the applications that got decided it was. But 1,327,968 of the 2,119,836 pending I-765 applications had already passed the six-month mark, so the typical case still waiting is at nearly triple the reported average and has not been counted yet.
Naturalization is the same pattern in a milder form. The average was 10.1 months, and 441,362 of the 712,572 pending N-400 applications were already past six months. Some will finish inside the average and many will not, and every one that runs long pushes next month's average up a little when it finally closes.
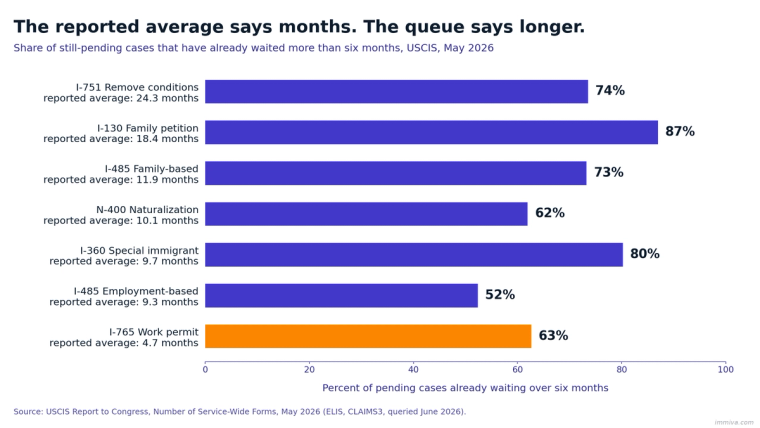
For every major form, most cases still in the queue in May 2026 had already waited longer than six months, regardless of how short the reported average was.
Why the gap keeps widening
A queue only stays stable when decisions keep pace with new filings. In May 2026 that did not happen for a single major form.
Across the eleven form categories in the report, USCIS took in 418,493 applications and completed 216,007 of them. That is roughly 52 decisions for every 100 filings, which means the pending pile grew by more than 200,000 cases in one month. The size of the shortfall varies a lot from form to form. Work permits came closest at about 60 decisions per 100 filings. The petition to remove conditions on a green card was the worst by a wide margin, at roughly 19 decisions per 100 filings, which is why the I-751 average of 24.3 months is likely to keep climbing.
When receipts outrun decisions like this, the pending pile grows and the cases inside it age at the same time. Older cases are the hardest ones, so they tend to be decided last, and each month they spend waiting is a month they spend outside the published average. That is what produces the gap. Nothing in the data is wrong; this is simply what a growing queue does to a statistic built from completions.
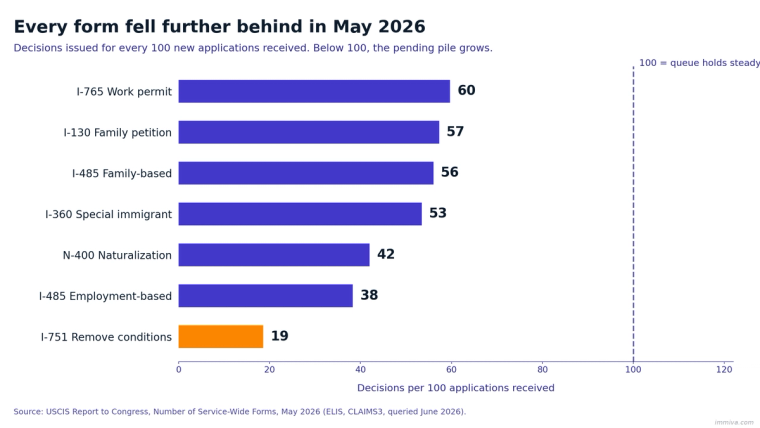
Decisions issued for every 100 new applications received in May 2026. Every major form came in below the break-even line, so every queue grew.
Two categories in the report are worth flagging separately because their numbers are not comparable. Adjustment applications filed under the Cuban Adjustment Act and by refugees recorded almost no approvals in May 2026, 27 and 29 respectively, against pending piles of 354,649 and 148,166. Those queues are effectively paused rather than merely slow, so the ratios above would be meaningless for them.
How to read these numbers for your own case
The published figures are still worth checking, as long as you ask them something they can answer. Instead of "when will my case be decided," ask "am I inside or outside the range where USCIS will talk to me."
That one has a real answer. USCIS accepts a case inquiry once your case has taken longer than the time it took to complete 93 percent of adjudications, and it calls those cases outside normal processing times (USCIS, More Information About Case Processing Times). The processing times tool calculates that date for you from your receipt date. Before it, an inquiry usually produces a form response. After it, the request is routed to the office handling your case.
A few habits make the numbers more useful.
Start with your own office rather than the national figure. The processing times tool reports by service center and field office, and the spread between locations is often wider than the difference between forms. Our form-level guides for N-400, I-130, I-485, I-751, and OPT break the current estimates down further.
Treat the average as a floor. If the posted figure is ten months and you are at month eleven, that is not unusual. Your case is in the part of the queue the figure leaves out.
And watch several months rather than one. A single month's average moves for reasons that have nothing to do with your case, including which batch of old files an office happened to clear, so the direction over time tells you more than any one figure. The same logic applies to family green card waits at each stage and to work permit renewal timing, where filing early is now the main defense against a gap.
What actually moves the needle on your wait
You cannot change staffing levels or the size of the queue. What you can change is whether your case picks up avoidable delay on top of the system's.
The biggest avoidable cost is a Request for Evidence. An RFE stops the clock on your case while you gather documents and USCIS re-reviews the response, and it commonly adds months to a case that was otherwise moving. A rejected filing is worse, because you go back to the end of the line with a new receipt date. Most RFEs come from gaps that were visible at filing: missing evidence, inconsistent dates across forms, an unsigned page, the wrong form edition. Those are exactly the gaps Immiva checks for, on every answer, before the package goes in rather than after USCIS writes back. Our guide to responding to an RFE covers what to do if one arrives anyway.
Beyond that, track your case from the receipt notice onward so you catch problems early rather than at month fourteen. Our walkthroughs on checking your N-400 status online and five ways to check an EAD application status cover the mechanics. And if you have a documented hardship, some categories accept an expedite request; our guide to I-485 expedite requests explains the criteria and the odds. Filing an accurate application the first time is the whole reason Immiva exists, at a fraction of what an attorney charges for the same forms.
The bottom line
The USCIS average processing time measures real work, but it measures the cases that finished rather than the ones still waiting. In a year when every major form is taking in roughly twice as many applications as it decides, a number built that way will reassure you without telling you much about your own case. Use the posted figure to work out when you can ask USCIS a question, and use the pending-over-six-months share to set your expectations. The one part of the timeline you control is whether you hand USCIS a reason to slow you down, so file cleanly.