
Most coverage of USCIS denial rates uses one number from one month. That hides the shape of what is happening. So we pulled all 20 monthly reports USCIS published between December 2024 and July 2026 and lined them up form by form.
Two things show up clearly. Refusals went up for almost every form we track. And the agency is deciding far fewer cases each month than it did 18 months earlier, while receipts have not fallen nearly as fast. Those two trends together explain why cases that used to take six months now take eleven, and why the pending caseload keeps setting records.
This post is about the numbers themselves: where they come from, what they do and do not mean, and what changes about your filing decisions. If you want the officer-level view of why individual citizenship cases get refused, we cover that separately in our breakdown of N-400 denial rates by field office.
Where these numbers come from
Every month USCIS publishes a short report titled Application Processing Data. It is required by Congress under the Consolidated Appropriations Act, 2022, and it is the only regular public source that gives receipts, approvals, denials, pending totals, and average processing time for the same forms in the same month (USCIS Immigration and Citizenship Data).
The report covers eleven form categories: I-130, I-360, I-751, I-765, N-400, and six separate I-485 categories. We combined the December 2024 through July 2026 files into one table and calculated three things.
Denial rate. Denials divided by approvals plus denials in the same month. This is the share of decided cases that ended in refusal. It is not the share of everyone who filed, because most filings are still waiting.
Decisions per 100 receipts. Approvals plus denials, divided by applications received that month. Below 100 means USCIS decided fewer cases than arrived.
Backlog age. The share of pending cases that have been waiting more than six months.
We also compared six-month averages rather than single months, because individual months bounce around. Unless stated otherwise, "early 2025" means December 2024 through May 2025, and "mid-2026" means February through July 2026.
USCIS denial rates rose across most forms
Across all eleven categories, the denial rate went from 10.3% in early 2025 to 15.9% in mid-2026. Strip out the three humanitarian I-485 categories where adjudications were largely paused, and the picture barely changes: 10.5% to 15.8%.
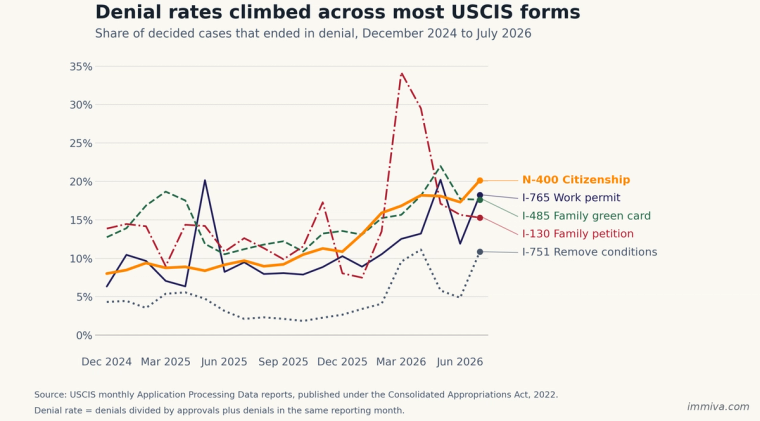
Denial rates for five major USCIS forms, month by month, from December 2024 through July 2026.
Naturalization shows the cleanest trend. The N-400 denial rate sat between 8% and 10% for most of 2025, then climbed every quarter after that, reaching 20.1% in July 2026. On a six-month average basis it roughly doubled, from 8.6% to 17.6%. That means one in five decided citizenship cases now ends in refusal, against about one in twelve eighteen months earlier.
The other forms moved less sharply, but in the same direction. Family petitions rose from 13.3% to 22.6%, work permits from 10.1% to 14.5%, and family-based green card applications from 14.9% to 17.4%. Removing conditions on a green card went from 4.6% to 7.8%: still the lowest rate of any form we track, but nearly double where it started.
Two caveats matter before you read too much into any single line on that chart. Monthly rates swing hard when a form has a small number of decisions, so the spikes are often noise. And a rising denial rate does not by itself tell you whether officers are applying stricter standards, whether the mix of cases being decided has changed, or whether older and more complicated files are finally being worked through. The data shows the outcome, not the cause.
Widen the frame to all eleven categories and the direction is close to unanimous. Comparing the first three months of the series against the last three, ten of eleven moved toward more denials. The two longest bars are the ones to distrust. In the Cuban and refugee categories approvals fell to almost nothing, which inflates the percentage without telling you anything about how cases are being decided. There is more on that further down.
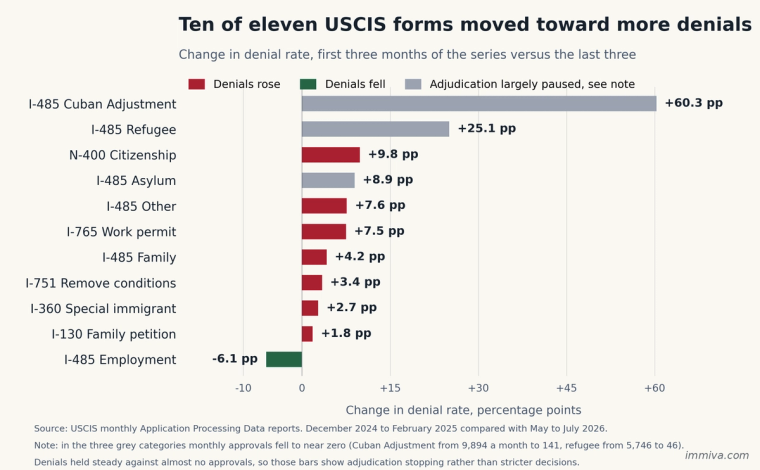
Change in denial rate for all eleven form categories, first three months of the series compared with the last three.
The bigger change is how few cases get decided
The denial numbers get the attention, but the drop in decision volume matters more.
In early 2025 USCIS was issuing about 555,000 approvals a month across these eleven categories. By mid-2026 that was down to about 221,000. Receipts fell too, from roughly 765,000 a month to 423,000, but nowhere near as far.
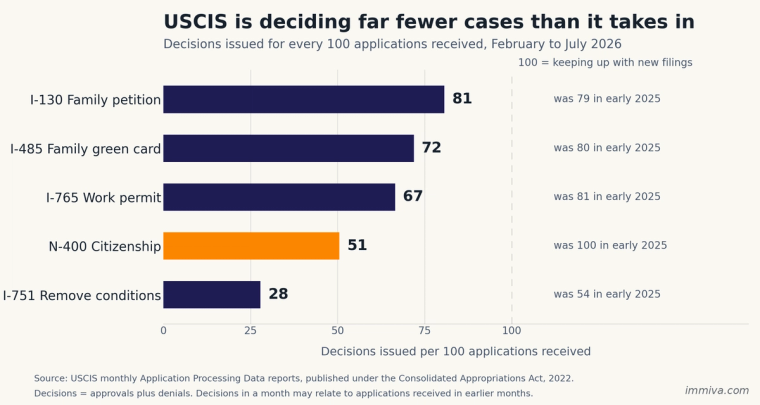
Decisions issued per 100 applications received, February through July 2026, compared with early 2025.
Naturalization is the sharpest reversal. Through early 2025 USCIS decided almost exactly as many N-400s as it received, 100 per 100. By mid-2026 it was deciding 51 for every 100 that arrived. Petitions to remove conditions are lower still at 28 per 100, down from 54.
The arithmetic from there is not complicated. Total pending across these categories went from 5.56 million at the end of 2024 to 7.59 million in July 2026. Cases waiting longer than six months went from 3.48 million to 5.73 million, which is now 75.5% of everything pending. Three quarters of the people waiting on a USCIS decision today have already been waiting more than half a year.
This is the mechanism behind the processing times people see on their own cases. We explain why the published averages understate what most applicants experience in our guide to how USCIS calculates average processing time.
What this means if your case is already pending
If you filed recently, the data says something uncomfortable: the queue you joined is getting longer, and it is getting older.
Naturalization went from an average of 6.1 months to 11.4 months over this period. The share of pending N-400s older than six months went from 22.2% to 62.3%. For work permits the average went from 3.0 to 5.8 months, and the over-six-month share went from 42.7% to 65.9%, which is what makes filing EAD renewals early matter so much more than it used to.
For pending cases there is not much you can do about timing. What you can still control is whether your file gives an officer a reason to issue a request for evidence or a denial when it finally reaches the top of the pile. A case that draws an RFE in month ten does not get decided in month ten. It goes back in line. That is the real cost of an avoidable error in a slow system, and it is why responding well to an N-400 request for evidence or an I-130 RFE is worth taking seriously.
Form by form: what changed
N-400 citizenship
The largest shift of any form. Approvals fell from a peak of 88,488 in April 2025 to 16,514 in July 2026. Pending rose from 535,601 to 778,489. Denial rate roughly doubled. Average processing time went from 6.1 to 11.4 months. If you are preparing a citizenship application, the good moral character questions and the continuous residence math are where cases get into trouble, and both are checkable before you file. Our N-400 processing time guide tracks the current numbers, and 12 N-400 mistakes covers the errors that come up most.
I-751 removing conditions
The lowest denial rate of any form, but the worst throughput. USCIS decided 28 cases for every 100 received in mid-2026. Pending grew from 217,205 to 350,668 and the average is now 23.5 months. Nearly three quarters of pending petitions are over six months old. Whether you are filing jointly or on a waiver, the evidence you assemble has to survive a two-year wait before anyone looks at it.
I-130 family petitions
Denial rate rose from 13.3% to 22.6%, the largest proportional jump after N-400, though monthly figures for this form swing widely. Pending stayed roughly flat at about 2.4 million because receipts fell alongside decisions. 87.4% of pending petitions are more than six months old. See our I-130 processing time guide and document checklist.
I-765 work permits
The biggest form by volume, and the one where delay does the most immediate damage, because a gap in the card means a gap in the right to work. Monthly approvals dropped from about 345,000 to 118,000. Pending nearly doubled to 2.1 million. Average processing time roughly doubled to 5.8 months, and two thirds of pending cases are already over six months old.
I-485 adjustment of status
The one place the trend reverses. Employment-based I-485 denial rates actually fell, from 14.1% to 6.7%. Family-based rose modestly, from 14.9% to 17.4%, with pending up to 604,449. The humanitarian categories are a different story entirely and are covered below. Our I-485 processing time guide and the family green card backlog breakdown go deeper on each stage.
The categories where the numbers mislead
Three I-485 categories show denial rates of 30% to 80% in recent months. Those figures are close to meaningless as denial rates. Refugee-based adjustments went from about 3,946 approvals a month to 34. Cuban Adjustment Act cases went from 7,797 to 80. Asylum-based adjustments went from 5,791 to 721. When approvals collapse to near zero, a small and steady number of denials produces an enormous percentage. What those categories show is that adjudication largely stopped, not that applicants suddenly became ineligible. We have excluded them from the headline figures for that reason.
What you can actually control
You cannot make USCIS decide faster. Three things are still in your hands.
File complete. Rejections for a missing signature, the wrong fee, or an outdated form edition do not put you at the back of the line. They mean you were never in the line. In a system where the wait is now measured in years for some forms, losing three months to a lockbox rejection is a real cost.
Answer the sensitive questions correctly the first time. Good moral character, travel history, address history, and arrest disclosure are where preventable denials concentrate. Those are not judgment calls about your worthiness. Most of the time, the applicant simply did not understand what the question was asking. Misreading a question is the single most avoidable way to end up in the denial column, and it is the part Immiva is built to catch. The software validates every answer as you go, flags the questions that carry denial risk with plain guidance before you commit, and checks the whole packet against the form requirements before you download it. It cannot make you eligible if you are not, but it can keep an eligible applicant from being denied over an answer they misread.
File as early as you are eligible. Every month you wait is a month further back in a queue that is lengthening. If you have flexibility on timing, the data argues for using it now rather than later.
That third point is where the free tools help. Immiva's eligibility check runs the requirements for your form and tells you what would flag before you commit to anything, and the residence and physical presence calculators do the day counting that trips up so many citizenship applications.
If you want the preparation handled end to end, Immiva covers N-400, I-751, I-130, and I-485, plus H-4 and J-2 work permits, for a fraction of what traditional lawyers ask. The USCIS filing fee is paid separately to the government. You see the verification report before you pay, and if USCIS rejects your packet because of a preparation error on Immiva's end, the fee is refunded. Immiva is software rather than a law firm, so it prepares and verifies forms and does not give legal advice about your particular case. If you need that advice, an attorney is the right call, and our breakdown of immigration lawyer costs covers what that runs.
The short version
USCIS denial rates rose across most forms between December 2024 and July 2026, roughly doubling for naturalization. The larger shift is that the agency is now deciding about half as many cases per month as it was, while three quarters of everything pending has already been waiting more than six months.
Neither of those is something an applicant can change. What you can change is whether your file is complete and correct when it finally gets read, and how soon you get into the queue. Both of those are worth more now than they were two years ago.